Tutorial: Advanced System Dynamics Modelling
This tutorial goes more in-depth on the advanced features of the Simantics System Dynamic tool. Namely modules, custom Modelica functions, special variables and enumerations (i.e. vector variables). We are going to build a model that simulates how a shared workforce works on several overlapping projects. You can think of the resulting model as a framework on which to build models that, for example, simulate a project portfolio of a company. It is advised that you complete the basic tutorial before starting. If you find yourself stuck, seek help from the documentation.
Creating model and modules
Start by creating a new model from File→New→SD Model, rename the model to WorkModel. Then create two new modules by right-clicking on the Modules folder under the WorkModel tree and selecting New→Module. Rename the modules to Workforce and Project by selecting them in the Model Browser and using the properties view.
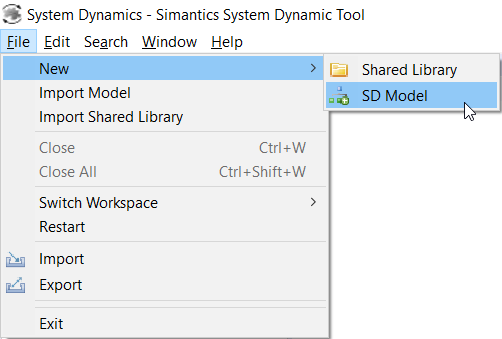
Creating a new model
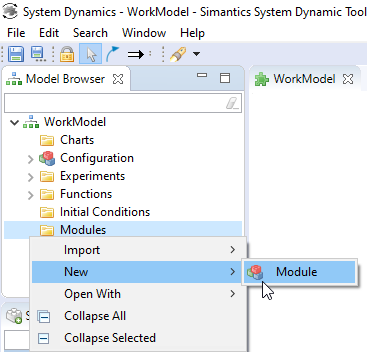
Creating a new module
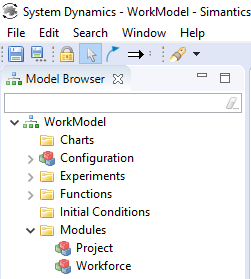
Model after renaming
Initial configuration
We will use a top-down approach in creating our model - focusing first on the bigger picture of the model and implementing the internal structure of the modules later.
Open the model configuration by double-clicking Configuration in your model browser. Drag one Workforce and one Project from your Model Browser to the WorkModel diagram. The modules are automatically named with a suffix number.
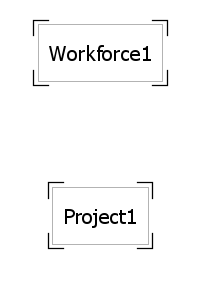
Workforce and Project modules
You can think of modules as user made components that communicate with rest of the model by having some input(s) and output(s). In this model the internal implementation of Workforce module should handle resourcing people to projects according to their needs. The Project module should simulate how the people that are assigned to that specific project are advancing the project.
While not used in this tutorial, Simantics System Dynamics supports nested modules, i.e. modules inside modules. Modules can also be exported and imported independent of the model.
Let's consider what kind of information we need to pass between the modules. First of all, the Project needs to tell the Workforce module how much workforce it needs. Create an input variable and name it to RequestedWorkingSpeed to pass this information along. Connect Project1 module to RequestedWorkingSpeed and RequestedWorkingSpeed to Workforce1 with a dependency arrow.
Input variable is a special type of symbol that acts as an interface between modules and the rest of the model. They are the only symbol type that can be connected directly to module outputs and they also act as the only way of creating inputs inside modules, as we will see later.
We also need to assign people to work for the project - the Workforce module needs to tell the Project module how well we can respond to the request. Create a new input variable called ResponsedWorkingSpeed and connect it to the modules with dependency arrows.
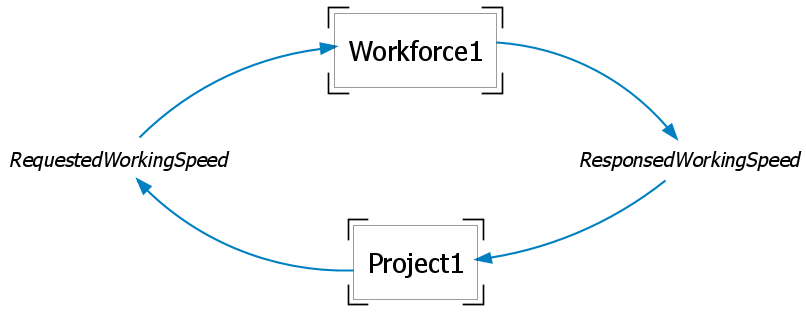
Workforce and Work modules, first inputs and connections
Now we have the first version of the top-level model structure completed, we can start configuring the modules.
Workforce module
Open the Workforce module by double-clicking it under the Modules folder.
First, create an input variable and name it to RequestedNumberOfPeople, this variable receives the request provided by the Project module. Then, create 3 auxiliary variables and name them NumberOfEmployees, EmployeesAssigned and NumberOfFreeEmployees. Lastly connect the variables as shown in the picture. The unit of these variables is number of people.
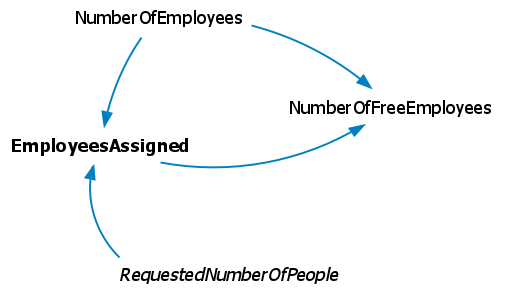
Internal structure of the Workforce module
Now we need to give the symbols equations, these are written below. To configure an equation, select a variable and write (or copy-paste) the corresponding equation to the text field in the Properties view. Connected variables are shown in the Variables list on the right side of the properties view. You can double-click on a variable name to insert it to the equation.
NumberOfEmployees
= 10

NumberOfFreeEmployees
= NumberOfEmployees-EmployeesAssigned

EmployeesAssigned
= min(RequestedNumberOfPeople, NumberOfEmployees)
Also, we need to decide what value(s) we want the module to output. Make sure that the Is Output checkbox is ticked on the EmployeesAssigned variable, as this is the variable that tells how many people can be provided for the project.
We are using a built-in function min() for calculating how many employees we are going to assign. You can find a list of these in the Model Browser under WorkModel→Functions→Built-in Functions.
On the first iteration of this model, we are going to have 10 fulltime employees that get assigned to a single project according to the request. We are going to expand the structure of this module to handle several projects later on in the tutorial. This module is now ready to be used as a part of the first iteration of the model.
Work module
Open Project module by double-clicking it on the Model Browser.
Create a flow of work with stocks and flows like in the picture. This loop says that there is some initial amount of work that is done at a certain speed, gradually becoming completed work. However, our workers are not perfect, as such errors can occur during work. These errors are first undiscovered, and as they are found they become work that needs to be completed.
You will see red exclamation mark next to the symbols due to empty equation fields, these are omitted from the tutorial images for clarity reasons. We will return to fill in these fields later.
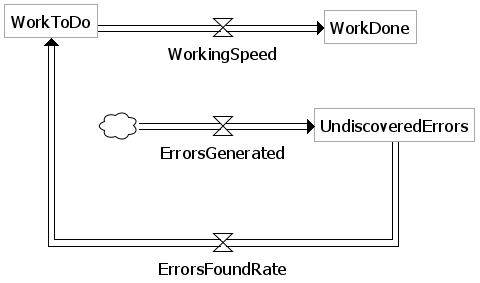
Basic work with errors
Next let's create variables that control the parameters of a project and handle the request of asking people for work. Create auxiliary variables: StartTime, Deadline, ProjectDuration, TimeToStartTime, TimeToDeadline, RequestedWorkingSpeed, ProjectWorkAmount and NumberOfWorkdaysInProject. Connect the symbols as in the picture and write the following expression to their expression fields. Click the checkbox Is Output on RequestedWorkingSpeed variable to make the module output the value of this variable.
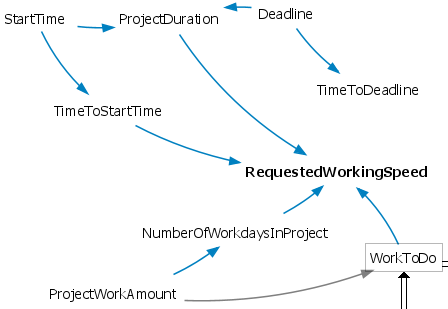
Structure of requesting people to work
StartTime
= 5

Deadline
= 20

ProjectDuration
= Deadline-StartTime

TimeToStartTime
= max(0, StartTime-time)

TimeToDeadline
= Deadline-time

RequestedWorkingSpeed
= if WorkToDo > 0 and TimeToStartTime == 0 then NumberOfWorkdaysInProject/ProjectDuration else 0

ProjectWorkAmount
= 500

NumberOfWorkdaysInProject
= ProjectWorkAmount/7
The project has parameters for starting time, deadline and budgeted hours of work. Based on these we calculate how many people the project needs, assuming that an average worker works for 7 hours per day. The number of people is handled as a floating point integer, meaning that one worker can work on multiple different projects.
Now let's create an input variable to take in the information of how much workforce we got from our request. Create an input variable and name it ResponseWorkingSpeedInput. We are also going to calculate how many hours a day the workers need to work in order to get the project ready in time and limit the result between 7 and 9 hours a day. Create two auxiliary variables and name them RequiredWorkHoursPerDay and TotalWorkHoursPerDay, connect them to other variables as in the image.
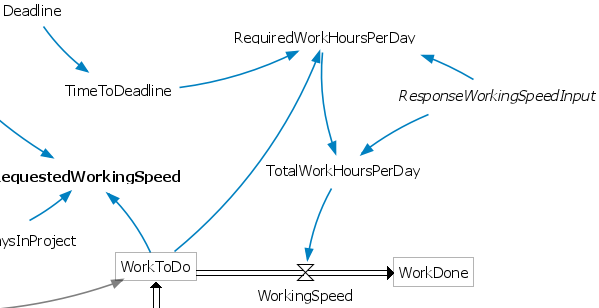
Input for responsed working speed
Write the following expression to the equation fields of the new auxiliary variables:
RequiredWorkHoursPerDay
= if ResponseWorkingSpeedInput == 0 then 0 else if TimeToDeadline < 0 then 9 else minmax(WorkToDo/ResponseWorkingSpeedInput/TimeToDeadline, 7, 9)

TotalWorkHoursPerDay
= RequiredWorkHoursPerDay*ResponseWorkingSpeedInput

WorkingSpeed
= TotalWorkHoursPerDay
Next we focus on completing the structure of the work loop. Create 2 auxiliary variables and name them WorkQuality and ErrorsFoundTime. Also, create two Shadow variables and select WorkQuality and ProjectWorkAmount as the referred variables. Shadow variable is a special type of variable, whose role is to pass along the referred variable value to a place where drawing a dependency arrow from the original symbol would make the graph difficult to read. Place the new symbols as in the image and make the dependency connections.
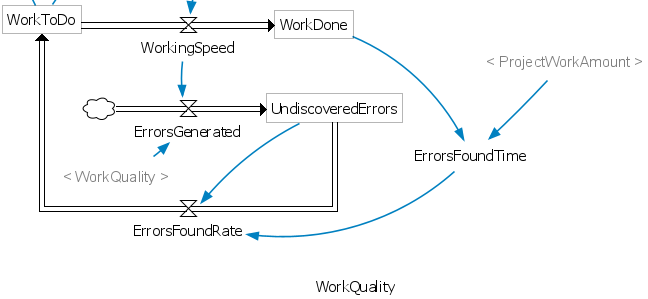
Completed work loop structure
Now that the structure of the work loop is completed let's input equations to the variables.
WorkToDo
Integral: ErrorsFoundRate - WorkingSpeed
Initial Value: ProjectWorkAmount

WorkDone
Integral: WorkingSpeed - ErrorsFoundRate
Initial Value: 0

ErrorsGenerated
= (1-WorkQuality) * WorkingSpeed

UndiscoveredErrors
Integral: ErrorsGenerated - ErrorsFoundRate
Initial Value: 0

ErrorsFoundRate
= UndiscoveredErrors/ErrorsFoundTime
For ErrorsFoundTime we are going to use a special type of auxiliary variable called WithLookup. WithLookup is a variable type where the value is interpolated from a 2-dimensional (Lookup) table using the value determined in the "With Lookup" field. Input the following values.
ErrorsFoundTime
Type: WithLookup
With Lookup: xidz(WorkDone, ProjectWorkAmount, 0.0)
Lookup table: {{0,5},{0.5,3},{1,0.5},{2,0.5}}
This variable makes it so that the less we have completed work the larger the variable value is and vice versa. And as we use this value in ErrorsFoundRate variable to divide the number of undiscovered errors, a practical interpretation would be that when we start working on a project we don't discover errors easily. But, as the project gets more and more completed we start to discover more and more errors made earlier on in the project.
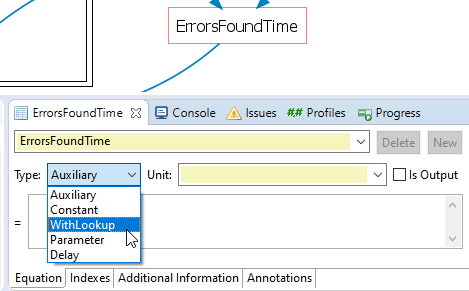
Choosing WithLookup as the auxiliary type
Now we are going to create a small feedback structure around WorkQuality. The purpose is to simulate how working overtime for a prolonged period causes fatigue. Create a stock variable called Fatigue and two flows, WorkingOverTime and SlowRecovery. Also create a shadow variable of RequiredWorkingHoursPerDay. Connect the variables as shown in the image.
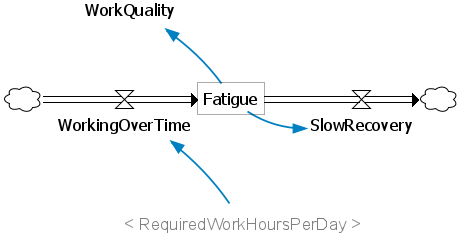
Structure around WorkQuality
Input the following equations to the variables:
WorkingOverTime
= if RequiredWorkHoursPerDay == 0 then 0 else (RequiredWorkHoursPerDay-7)*0.025

SlowRecovery
= if Fatigue >= 0 then 0.03 else 0

Fatigue
Integral: WorkingOverTime - SlowRecovery
Initial Value: 0

WorkQuality
= max(0.95*(1-Fatigue), 0.7)
Now working overtime causes fatigue to build up slowly, and fatigue in return causes work quality to decrease. This in return makes the workers more prone to do errors while working, causing more work to do, increasing the need for overtime work.
There is only one thing left to do for this module, we are going to create variables that tell when the project was completed. An intuitive approach would be to claim that a project is complete when the value of WorkToDo goes to zero. However, due to the structure of the work loop we are likely to find some errors even after the WorkToDo goes to zero. We solve this by recording the time when WorkToDo is zero (or under) for the first time.
Create a ghost variables of WorkToDo and Deadline. Then, create three auxiliary variables called ProjectIsCompleted, ProjectCompletitionTime and DaysLateOnDeadline. Connect the variables as in the image.
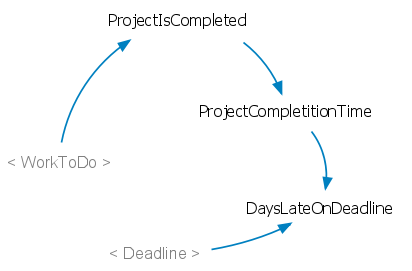
Structure of DaysLateOnDeadline
The variables use the following equations:
ProjectIsCompleted
= if time == 0 then 0 else if WorkToDo > 0 and ProjectIsCompleted == 0 then 0 else 1

ProjectCompletitionTime
= if ProjectIsCompleted == 0 then time else ProjectCompletitionTime

DaysLateOnDeadline
= ProjectCompletitionTime-Deadline
You can think of ProjectIsCompleted as a Boolean variable that goes to 1 and stays there when WorkToDo goes to 0 for the first time. ProjectCompletitionTime keeps track of time until the project is completed.
Now the Project module is complete.
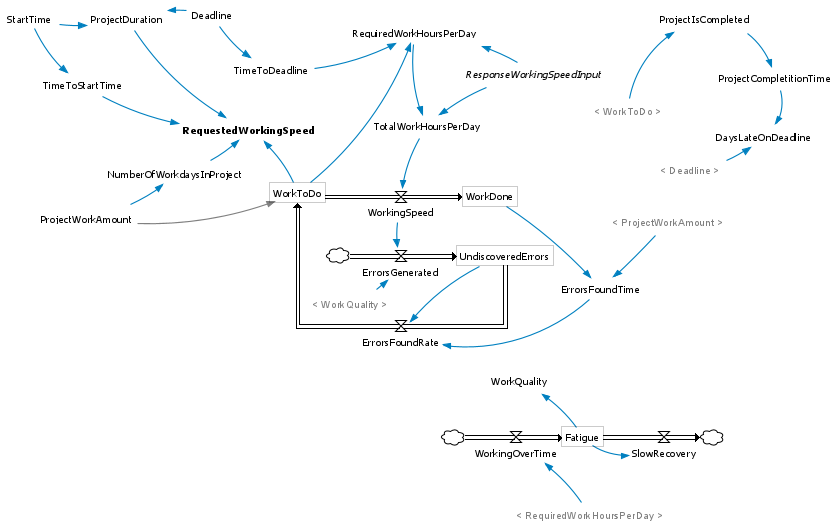
Completed Project module
Connecting modules
Now that our modules are complete, let's get back to the WorkModel Configuration and connect the inputs and outputs of the modules. Select Project1 and then select Outputs tab from the properties view. Select the only available variable as the connection. Do the same in the Inputs tab. And repeat this process for Workforce1 also.
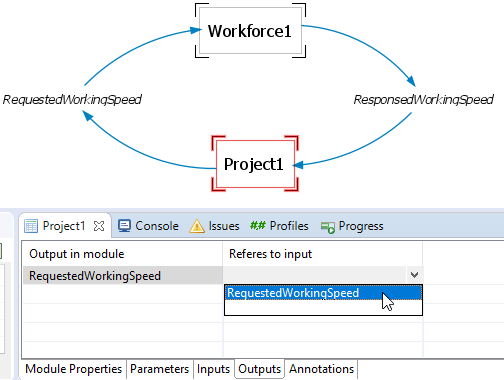
Module input connections
Now your model is ready for simulation!
Simulating the model
To make the simulation time longer, select Configuration on the model browser. Give the model Stop time 50.
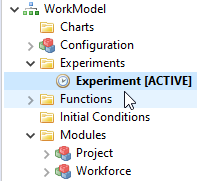
Experiment activation
To run simulations, you must activate an experiment. Expand the experiments folder on your model browser. There is one ready-made experiment. Double-click on the experiment and the experiment control buttons appear on the toolbar. To simulate the model, press the play button:

System shows the simulation progress in the progress bar on the lower right corner of the screen.

When the progress indicator disappears, the simulation is complete.
If the Console view pops up and shows an error "Error: Too few equations, underdetermined system. The model has X equation(s) and Y variable(s)", the simulation has failed. The reason might be that you forgot to assign an equation to some variable or some connection in modules. See through all the variables, write the missing equation and simulate again.
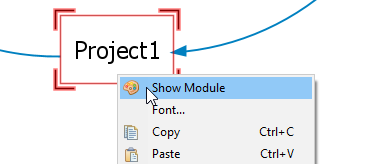
After the simulation has successfully completed, you can select a variable from model browser under Configuration to see its values over time in the trend view. You can also right-click on a module and select Show Module. This brings up a view of the internal structure of the module instance used in the simulation. Selecting a variable from there will show its values in the trend view.
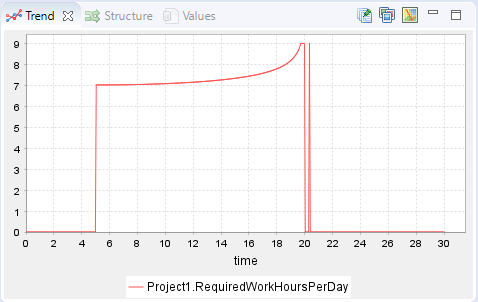
For example, RequiredWorkingHoursPerDay variable in Project1 module should give the following graph. At first assigned workers are working 7 hours per day, but they start working more when the deadline starts closing in. After the project is completed, a few undiscovered errors are found and workers return to correct them.
Adding modules
Now that we have a model with one Project module we are going to expand the model to support as many Projects as we want. First, we need to make some restructuring on the top level. Delete the dependency arrow that goes from ResponsedWorkingSpeed to Project1 module, also delete RequestedWorkingSpeed symbol entirely. Now create two new auxiliary variables and name them RequestedWorkingSpeed and WorkforceProject1. Connect the new auxiliaries as in the picture, remember make the connection inside the module properties as well.
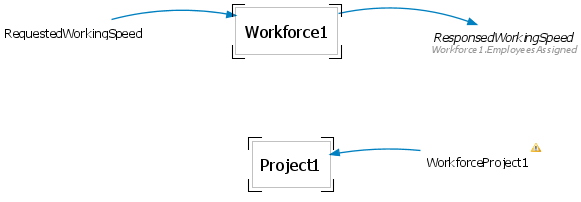
Updated model structure
Write the following equations inside the new variables:
RequestedWorkingSpeed
= Project1.RequestedWorkingSpeed

WorkforceProject1
= ResponsedWorkingSpeed
Notice that we can access variable values without having dependency arrows connected, we are given a warning next to the symbol as this should be done only when you know exactly what you are doing. Also, note that we can access values inside modules by using a dot notation modulename.variablename.
Simulate the model once to make sure nothing broke.
Next create a new Project module and a corresponding auxiliary variable WorkforceProject2, connect the auxiliary variable to the module and make the input connection in the module settings.
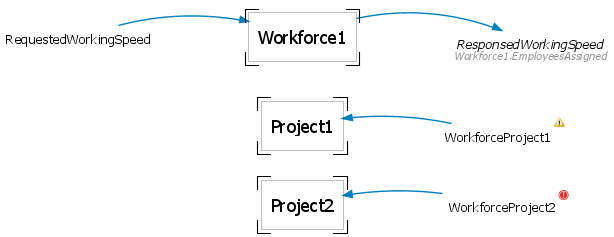
Updated model structure
Now we need to make the Workforce1 module to work with several projects at the same time, for this we use enumerations. You can think of enumerations as indices of a vector variable. To create an enumeration right-click on Configuration and select New→Enumeration.
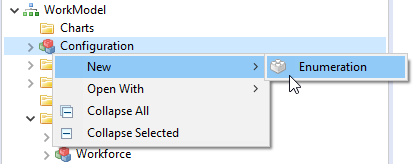
Creating a new enumeration
Select the newly created enumeration under Configuration and rename it to Projects. Then, select the enumeration and from properties view click twice on Add, rename index and index2 to Project1 and Project2 respectively.
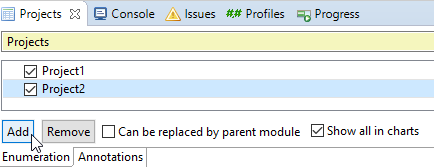
Creating new indices for Projects enumeration
Now we have created the needed enumeration for the top level model. We need to create one for the Workforce module as well. Under the Modules folder in the model browser right-click on Workforce, select New→Enumeration, name it Projects and add a single dummy enumeration. Then make sure the checkbox Can be replaced by parent module is checked. Then select Workforce1 module and from Module Properties overwrite enumeration Projects with Projects. This way we only have to update enumerations in one place when adding new projects to the model.
Now we need to select which variables use the enumerations, i.e. what scalar variables we need to turn into vector variables. In the top-level model select RequestedWorkingSpeed and ResponsedWorkingSpeed by holding down ctrl while left-clicking on the symbols, this should bring up a view that allows you to add enumerations to the selected symbols. From the left select Projects by left-clicking and click on the arrow, Projects enumeration should appear on the right side.
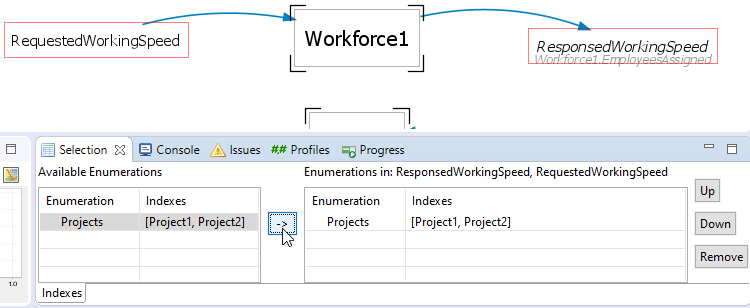
Adding enumerations to symbols
We need to change the equations of RequestedWorkingSpeed, WorkforceProject1 and WorkforceProject2. RequestedWorkingSpeed needs information from both Project modules and WorkforceProject variables should be scalars. Input the following equations:
RequestedWorkingSpeed
= {Project1.RequestedWorkingSpeed, Project2.RequestedWorkingSpeed}

WorkforceProject1
= ResponsedWorkingSpeed[Project1]

WorkforceProject2
= ResponsedWorkingSpeed[Project2]
Next we need to update the structure of Workforce module so that it handles vector variables. Open the module by right-clicking on Workforce1 and selecting Show Module.
Select variables EmployeesAssigned and RequestedNumberOfPeople and add the Projects enumeration to them as before.
Now we are going to create a custom function that allocates people to projects. To create a custom function, in the Model Browser right-click on Functions folder and select new→Function. Now click on the newly created function and rename it to AssignWorkersToProjects.
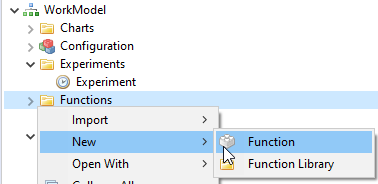
Creating a new function
Write (or copy-paste) the following Modelica code to the empty text field. When working with custom Modelica functions note that you need to press shift+enter to create new lines.
public input Real requestedhr[:];
public input Real totalrequestedhr;
public input Real availablehr;
public output Real allocatedhr[size(requestedhr, 1)];
algorithm
requestaspercentage := zeros(size(requestedhr, 1));
nofpeople := zeros(size(requestedhr, 1));
for i in 1:size(requestedhr, 1) loop
	requestaspercentage[i] := xidz(requestedhr[i], totalrequestedhr, 0);
	nofpeople[i] := min(availablehr*requestaspercentage[i], requestedhr[i]);
	allocatedhr[i] := nofpeople[i];
end for;
To give you a quick rundown of the code logic, we have 3 input variables. First one tells how much workforce each projects wants, the second tells what the total number of requested people is and the third tells how many employees we have. The function outputs a vector that tells how many people it assigned to which project. In case there is more demand than available workforce, we calculate what percentage of the whole demand each project contributes and assign people accordingly.
Now that our custom Modelica function is ready we are going to use it in the EmployeesAssigned variable. Select EmployeesAssigned and on the right of the properties view select Function tab, double-click on the custom function to make it appear in the equation field. Give the function following parameters: RequestedNumberOfPeople, sum(RequestedNumberOfPeople), NumberOfEmployees.
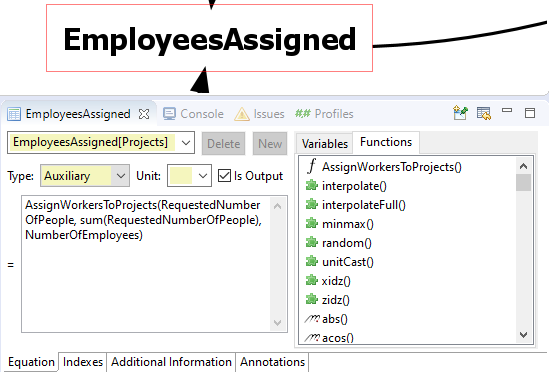
Our custom function in variable properties view
Finally we need to change the calculation logic of NumberOfFreeEmployees. As EmployeesAssigned is now a vector variable just add sum() function around it in the equation field.
NumberOfFreeEmployees
= NumberOfEmployees-sum(EmployeesAssigned)
Now the Workforce module is completed!
Finally, we are going to give the projects different parameters. Select Project2 and from the properties view select Parameters tab. By slowly double-clicking on a value you can change the starting time, deadline and work amount of a project.
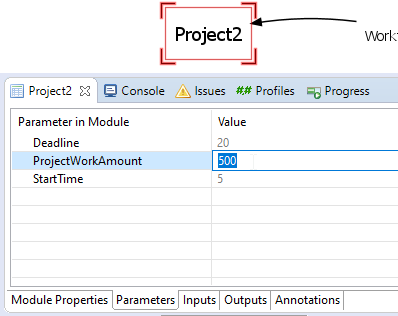
Parameters of Project2
Set the following parameters.
Deadline: 40
ProjectWorkAmount : 900
StartTime: 0
Now we have completed a model with two Project modules, simulate to make sure your model is working.
By following the steps below you can add a new project module to the model. Our current implementation supports any number of projects.
1. Add a new Project module to the diagram
2. Add a new auxiliary variable and name it WorkforceProject3
3. Connect the new auxiliary variable with the module using a dependency arrow and connect it to the module in the input tab
4. Update the equation field of RequestedWorkingSpeed to {Project1.RequestedWorkingSpeed, Project2.RequestedWorkingSpeed, Project3.RequestedWorkingSpeed}
5. Choose Project enumeration under configuration and add click add, name the new index to Project3
6. Write ResponsedWorkingSpeed[Project3] as the equation for the new auxiliary variable
7. Finally, customize the parameters of Project3 module in the Parameters tab
Create a third Project module using the instructions above with the following parameters.
Deadline: 20
ProjectWorkAmount : 300
StartTime: 10
To make the results of the simulation more readable we can add auxiliary variables that collect information from each of the Project modules. For example, we might be interested the behaviour of WorkQuality, RequiredWorkingHoursPerDay and DaysLateOnDeadline. Create an auxiliary variable for each of these, add Project enumeration to them and input the following equations.
DaysLateOnDeadline
 = {Project1.DaysLateOnDeadline, Project2.DaysLateOnDeadline, Project3.DaysLateOnDeadline}

 RequiredWorkHoursPerDay
 = {Project1.RequiredWorkHoursPerDay, Project2.RequiredWorkHoursPerDay, Project3.RequiredWorkHoursPerDay}

 WorkQuality
 = {Project1.WorkQuality, Project2.WorkQuality, Project3.WorkQuality}
Remember to update these variables also if you intend to use more than 3 projects.
If you now simulate the model the results of RequiredWorkHoursPerDay should look like this.
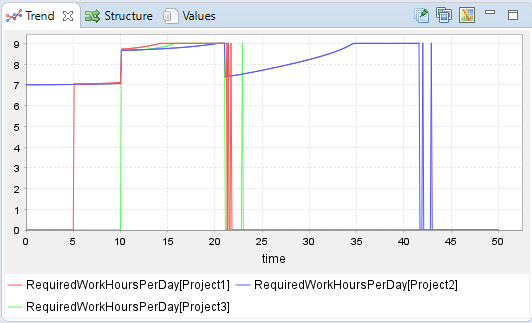
RequiredWorkHoursPerDay results
And WorkQuality should look like this.
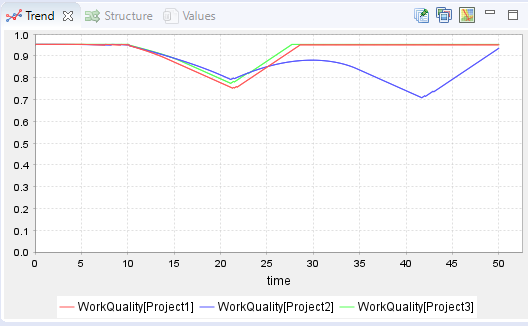
WorkQuality results
Reading results from DaysLateOnDeadline variable is hard as the variable keeps track of time before the deadline. To see the results more clearly we are going to create a custom bar chart. Right-click on Charts folder under the WorkModel and select New→Bar Chart, rename the chart to Project deadlines and rename the Title to Days late on deadline. Then choose the tab Variables, click on Add, select Write variable name and write DaysLateOnDeadline to the field. Bar charts automatically use the last time step of the simulation when retrieving variable values. The chart should like this.
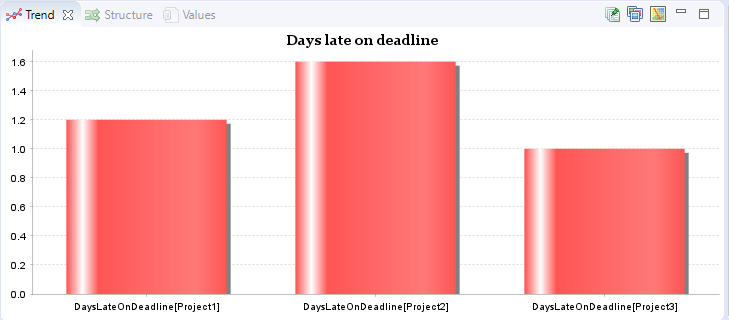
DaysLateOnDeadline results
Now you have completed the advanced Simantics System Dynamics tutorial.
There are some features that neither of the tutorials cover that can be found in the documentation.
If you still want to practice using the tool, here are some ideas on how to further develop the model we just made.
1. The number of employees is currently a static variable, think of ways to simulate the hiring procedure of a company using stocks and flows
2. Add more projects and think of ways to optimize project scheduling
3. Add wages to employees and an external workforce that is used in case internal workforce isn't enough, minimize total costs
Happy simulating!